MapoftheUniverse.net allows users to travel through space and look back toward the dawn of the cosmos with its interactive online map.
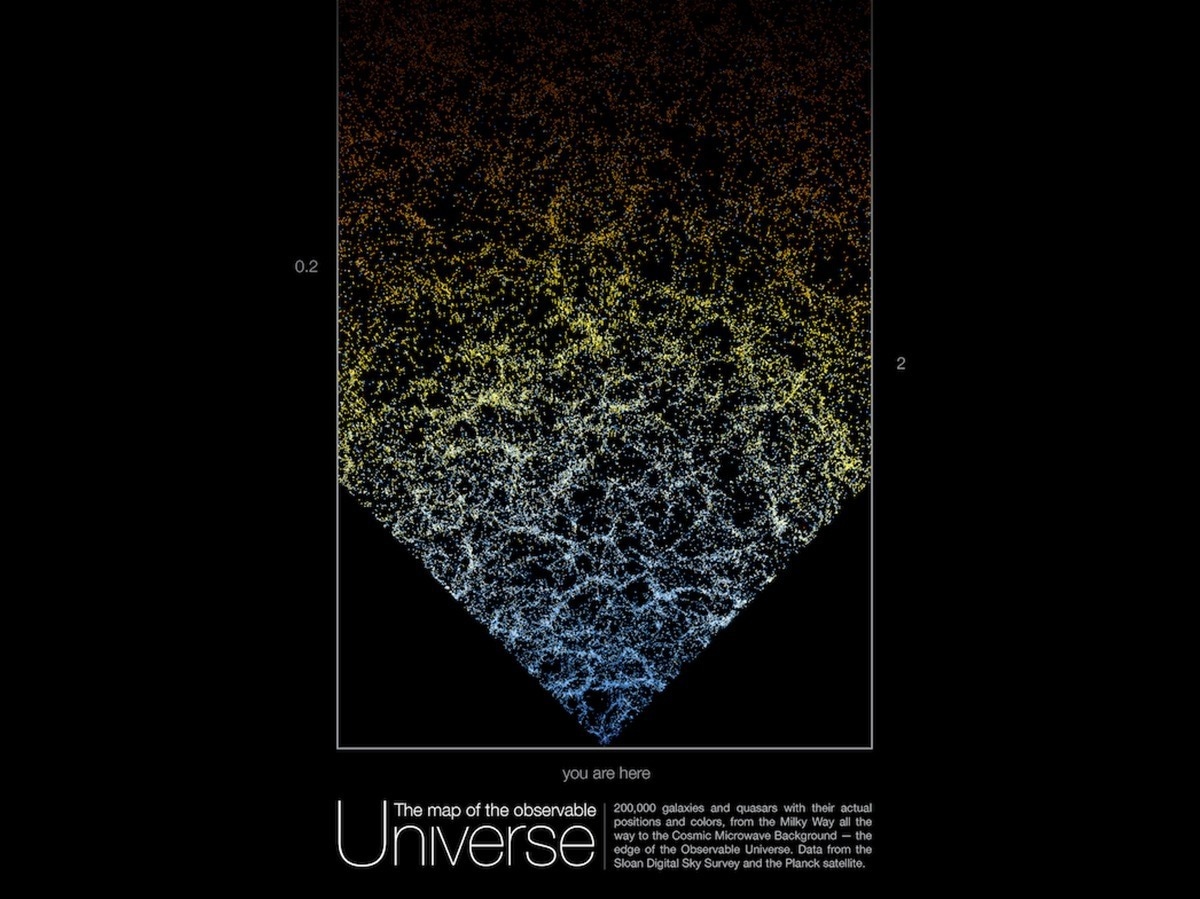
Image Credit: mapoftheuniverse.net
Who hasn’t stared up at the stars at some point and wondered at the magnitude of the cosmos, dreaming about visiting distant galaxies, stars, and planets?
That cosmic wanderlust is only amplified when considering that because light takes a finite time to travel to earth we are looking at these distant cosmic objects as they were thousands, millions, or even billions of years ago.
This means that every image captured by a telescope and even every glimpse at the night sky is a journey through space and back in time.
Of course, taking a cosmic trip like this is out of the question, but now thanks to researchers at Johns Hopkins University and fifteen years of data collected by the Sloan Digital Sky Survey (SDSS), space enthusiasts can enjoy the next best thing.
The group of astronomers has created an interactive map of the observable universe that can be downloaded for free by anybody. The map represents a slice of the universe and shows around 200,000 stars.
Seeing Red
One of the first things that users of the interactive map of the cosmos will notice is the colorful dots scattered across it. Each one of these dots is a galaxy placed in its actual location.
The reason these galaxies have a wide variation in colors, from yellow to red to blue, is the result of the fact that the universe is expanding.
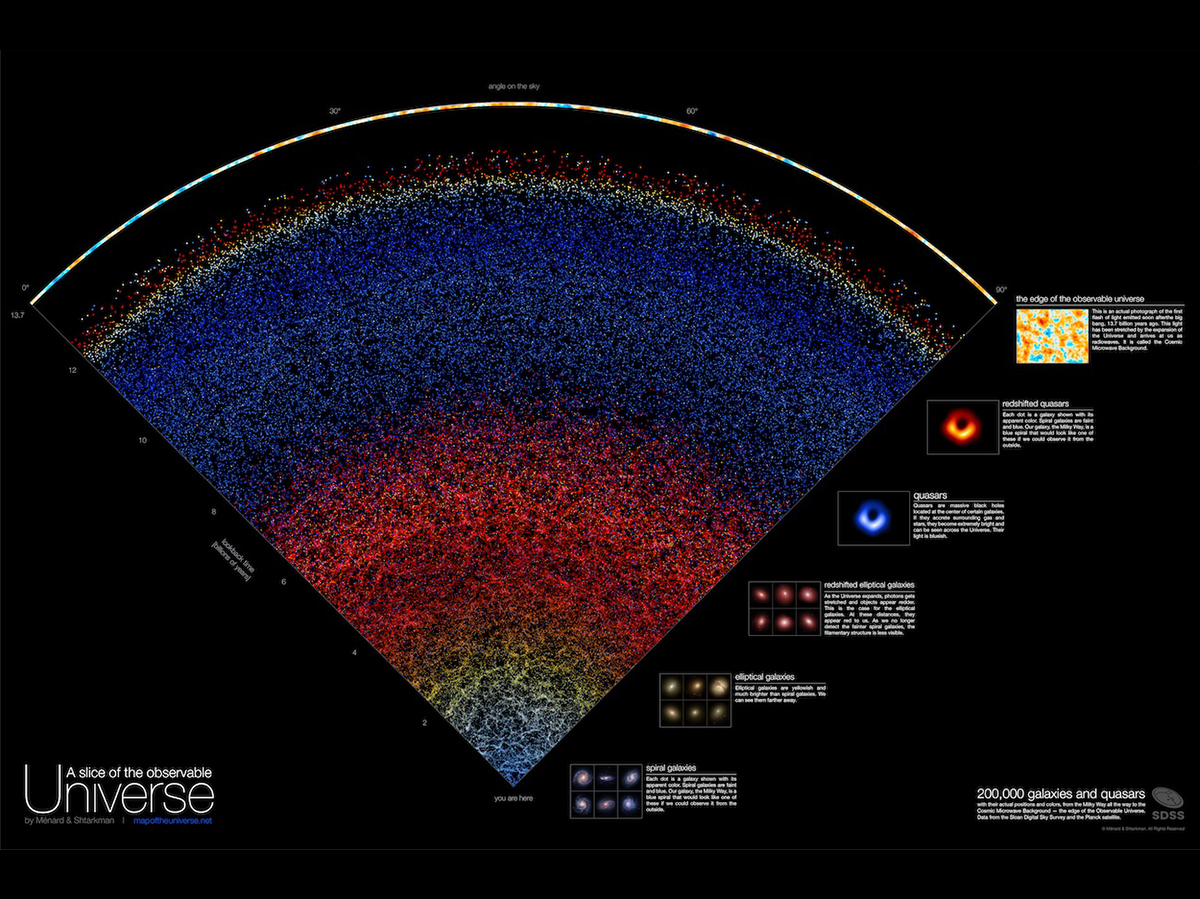
Image Credit: mapoftheuniverse.net
As the universe expands, the wavelength of light is stretched moving towards the red end of the electromagnetic spectrum. The further away a light source is, the more rapidly it is moving away, and thus the more extreme the redshift.
Thus, the red dots are distant galaxies, while the yellow dots represent galaxies at an intermediate distance. The blue-toned dots represent nearby galaxies. In fact, some could actually be moving towards our galaxy and thus the wavelength of light they emit is being compressed, making it appear ‘bluer.’
This red and blue shift is analogous to how sound waves travel here on Earth. When a siren approaches us, soundwaves are bunched up; when the siren recedes, the soundwaves are stretched out. This is why an ambulance or police car speeding past us seems to change tones as it does so.
With these colors explained, your eyes may be drawn to the multicolored shell at the top of the interactive map.
Back to the Start
At the very top of the map is the first flash of radiation that ever traveled through the universe, early on in its 13.8 billion-year history and shortly after the Big Bang.
Represented as a multicolored shell, this fossilized light is connected to an event in the universe’s early history called the ‘last scattering’, so it is often called ‘the surface of last scattering’, though science enthusiasts may know it better as cosmic microwave background (CMB).
As the early universe rapidly expanded after the initial expansion period we call the Big Bang, it also cooled, eventually reaching a temperature low enough to allow electrons to bond with protons.
This formed the first atoms, and the universe’s lightest element hydrogen, which in its simplest form is just one proton orbited by a single electron. Occurring about 380,000 years after the Big Bang, this event — called the epoch of reconnection — had a consequence beyond the creation of matter.
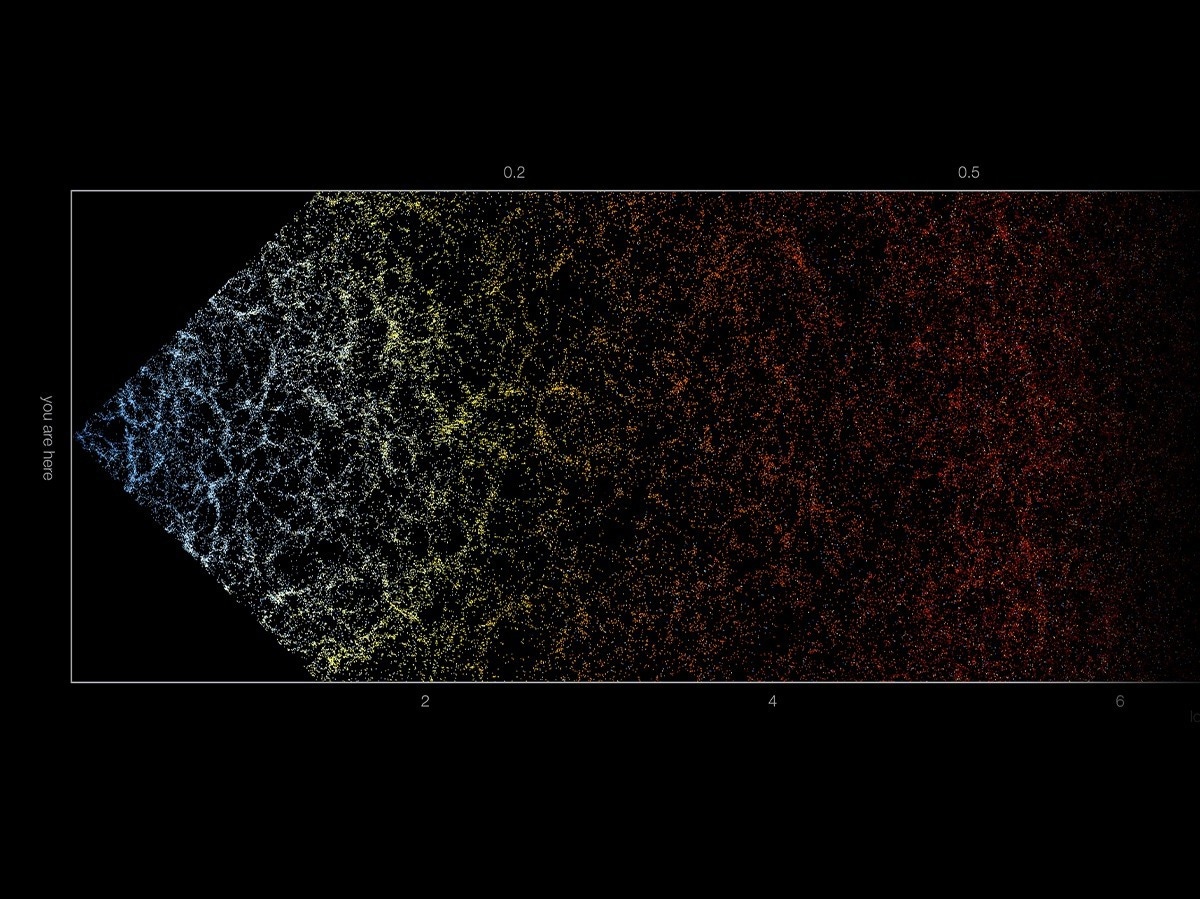
Image Credit: mapoftheuniverse.net
Free electrons in the universe were endlessly scattering photons — the fundamental particles of light. As a result, light couldn’t travel and the universe was essentially opaque. This instantly changed during the epoch of reconnection, with the universe suddenly becoming transparent to light.
That first light free to travel is the CMB, which also has its wavelength stretched by the expansion of the universe and is losing energy as a result of this redshift. Today, the CMB ubiquitously fills the universe with a uniform temperature of -2.73 Kelvin.
The reason this is the limit of what we can see on this map is that this is the edge of the observable universe. Any light omitted beyond this point hasn’t reached us because its travel time is longer than the age of the universe.
There is no light marked on the map beyond this point as there is no instrument on Earth that could possibly ‘see’ it.
Like the ancient maps of early explorers that showed the edge of the world, beyond which lay mysteries, this most modern map displays what is for all purposes the edge of the universe.
At the opposite end of the interactive map to this first primordial light is our galaxy, the Milky Way. The Milky Way doesn’t actually hold any particularly special place in the universe, appearing as nothing more than a tiny insignificant speck at the base of the cosmic map.
Our solar system and planet lie within this speck, incomprehensibly small and unviewable, giving users a taste of how insignificantly small we are on a cosmic scale.
More from AZoQuantum: Has the Winchcombe Meteorite Unlocked the Mystery of Earth’s Oceans?
Sources
The Map of the Observable Universe, [https://mapoftheuniverse.net/]
Disclaimer: The views expressed here are those of the author expressed in their private capacity and do not necessarily represent the views of AZoM.com Limited T/A AZoNetwork the owner and operator of this website. This disclaimer forms part of the Terms and conditions of use of this website.