In modern scientific research environments, effective software packages are essential, as choosing the correct software enables researchers to collect pertinent data more efficiently and plan more advanced studies. This article outlines how to use two Python packages, LabOne Q and Qudi, for color-center studies.
Qudi is an open-source Python package produced at the University of Ulm’s Institute for Quantum Optics. It can integrate a wide range of laboratory hardware with efficient measurement and data acquisition workflows. It was first created for studies related to nitrogen-vacancy (NV) centers in diamonds and color centers.
Compatible with Qudi, LabOne Q is an open-source Python package created by Zurich Instruments that provides an advanced range of software exclusively created for the dynamical control and quantification of multi-qubit systems, alongside the automation of quantum studies.
The package manages real-time instrument synchronization, instrument orchestration, and pulse sequencing to produce time-domain studies on a nanosecond timescale.
In a few lines of code, popular color-center studies such as photoluminescence excitation (PLE) and optically detected magnetic resonance (ODMR) spectroscopy can be implemented.
A spin study of color centers at the Institute of Applied Quantum Technologies (AQuT) of the Friedrich-Alexander-Universität Erlangen-Nürnberg was recently conducted. Led by Professor Roland Nagy, the research group uses Qudi as the software for its studies.
In this particular color-center arrangement, the color centers are produced from electron irradiation of 4H-SiC. Because of the Stark effect, their spin-resolved state energies can be shifted and employed as an indicator of the local electric field.1
The spin-dependent states are either directly addressed by rf signals or lasers, both managed by a high-density arbitrary waveform generator (HDAWG). Along with this, the HDAWG triggers the photon readout module.
For studies that require greater frequency ranges (beyond 750 MHz), an SHFSG Signal Generator for frequencies from DC to 8.5 GHz can be configured using the same software packages: Qudi and LabOne Q.
This article will first explore how time-domain experiments can be planned with LabOne Q and then demonstrate how LabOne Q and Qudi interact with each other. The PLE experiment will then be outlined in detail.
LabOne Q Experiment
For researchers who want to get started with the coding, how-to guides for NV center studies are available online. The following example helps researchers interested in understanding how LabOne Q simplifies experimental design.
LabOne Q enables time-domain studies to be defined at the pulse level, along with managing data collection and planning the experiment. The Experiment object outlines the pulse sequence, which is called the real-time part (as shown in the code snippet below).
## Experiment definition
exp = Experiment(
uid="Minimum",
signals=[
ExperimentSignal("drive"),
],
)
voltage_sweep = LinearSweepParameter(
'amp_sweep',
start=0,
stop=0.5,
count=21
)
# The experiment
with exp.sweep(voltage_sweep):
# set laser voltage, measure the laser wavelength
# with the wavemeter
exp.call(
'set_laser_voltage_and_measure_wavelength',
voltage=voltage_sweep
)
with exp.acquire_loop_rt(
uid="shots",
count=100
):
# The section
with exp.section(uid="Section_name"):
# Section contents
exp.play(
signal="drive",
pulse=pulse_library.const(
uid="pulse_name",
length=100e-9, # in units of s
amplitude=0.9 # in units of
# the full-scale
),
)
exp.delay(
signal="drive",
time=100e-9, # in units of s
)
This sample of code sets up an Experiment object with a single ExperimentSignal (“drive”). Subsequently, the code defines the specification of a sweep of the laser voltage. For each voltage step, the voltage value is programmed and recorded utilizing the near-time callback function set_laser_voltage_and_measure_wavelength.
Next, the study moves into its real-time stage in which sequences are repeated, producing several shots. In this particular study, one shot consists of a 100-nanosecond constant-amplitude pulse before an idle 100-nanosecond period.
One hundred shots are included in the complete real-time study, meaning the pattern runs 100 times. This example can be expanded to contain advanced pulse sequences and additional ExperimentSignal lines.
LabOne Q provides many practical tools to enhance accessibility when developing quantum experiments. For instance, studies can be carried out in the emulation mode, which lets users build and verify experiments entirely offline.
The pulse sheet viewer is an interactive feature that enables users to validate the timing of each channel across an entire study.
Software Interface Between Qudi and LabOne Q
LabOne Q experiments can be integrated into Qudi, a software frequently employed by color center and NV researchers. Qudi’s modular architecture handles the LabOne Q studies and HDAWG hardware efficiently.
Hardware modules, also called the interface class, are used by Qudi to create communication with a physical device. In this study, a new hardware module for the HDAWG was written as ZurichInstruments.py in qudi/hardware/, which is inherited from the class PulserInterface.
Then the necessary functions for managing LabOne Q studies are deployed, such as create_device_setup(), create_session(), create_experiment(), compile_experiment(), and execute_experiment(). All these functions are wrappers around various LabOne Q components.
Zurich Instruments provides an online outline of the various components (experiment, session, and device setup) and NV center experiment how-to guides. The company can also be contacted directly for any queries about the range of LabOne Q components.
Qudi leverages logic modules for a range of study types. If the HDAWG is expected by the experiment logic module (in qudi/logic/), the Connector class must be used to connect that logic module to the hardware module ZurichInstruments.py.
Lastly, Connector is employed to connect the logic modules to the related GUI modules.
The arrangement of the equipment in the Zurich Instruments QCCS Quantum Computing Control System is facilitated by the LabOne Q software. The system may appear to the researcher like a standalone instrument, but it often comprises multiple instruments. Due to this, it is recommended to always write one Qudi hardware module per setup, not for every instrument.
Color Centers in SiC
The Qudi codes and the HDAWG hardware form the setup for quantum studies in color centers. In this study, the device under test (DUT) is 4H-SiC with included cubic VSi centers. Electron irradiation is used to introduce the VSi centers before an annealing stage. The energy-level diagram for this type of VSi center is shown in Figure 1.
It has a total spin S = 3/2 with two spin-conserving optical transitions. The transition connects the spin-1/2 ground and excited states,  and
 , whereas the transition connects the spin-3/2 ground and excited states,
 and
 . The two spin-dependent ground states have a zero-field splitting of approximately 70 MHz.
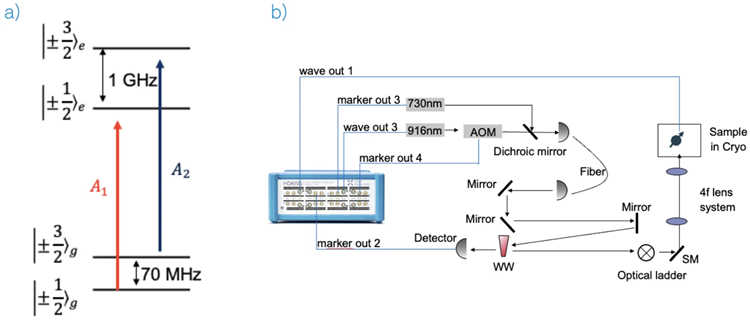
Fig. 1. a): A schematic of the energy level of a VSi center in 4H-SiC with the two transitions A1 and A2. b): The HDAWG is wired to perform the PLE spectroscopy experiment. The description is in the main text. Image Credit: Zurich Instruments AG
Experimental Setup
A 4 K cryostat with a home-built confocal microscope is used to house the DUT. For off-resonant excitation, a 730 nm laser is used, while a 916 nm laser is used for resonant excitation. An acousto-optical modulator (AOM) is employed to pulse the 916 nm laser.
The 916 nm laser’s wavelength is tuned via a DC voltage, and a wavemeter can be used to measure it. The excitation light is reflected towards a scanning mirror (SM) and targeted on the DUT within the cryostat.
The fluorescence is routed to a superconducting nanowire single-photon detector (detector). A Swabian Instruments’ Time Tagger Ultra is employed to identify the detector counts.
The HDAWG manages the AOM and the Time Tagger, tunes the resonant laser’s frequency, and produces the RF signal for the shift between the two spin-dependent ground states.
For instruments that must be triggered or turned on and off, the HDAWG marker ports are connected, producing a low or high voltage level. The HDAWG wave ports are connected for devices that require analog voltage values.
Acknowledgments
Produced from materials originally authored by Luk Yi Cheung from Zurich Instruments.
References and Further Reading
- Scheller, D., et al. (2025) Quantum Enhanced Electric Field Mapping Within Semiconductor Devices. Physical Review Applied, 24, 014036. DOI:10.1103/pv13-vgcw. https://journals.aps.org/prapplied/abstract/10.1103/pv13-vgcw.

This information has been sourced, reviewed, and adapted from materials provided by Zurich Instruments AG.
For more information on this source, please visit Zurich Instruments AG.