Phonon Spectra evaluation is much needed in scientific studies and is carried out with density functional theory (DFT). However, DFT has its disadvantages, with the time taken being a significant one.

Image Credit: Sergey Nivens/Shutterstock.com
This article introduces a software called Phonon Explorer for analyzing large datasets of the neutron scattering function. With this software, the amount of time needed to determine phonon dispersions, eigenvectors, and line widths is drastically reduced.
Scientific studies generally require extensive investigations of phonon dispersions and other lattice dynamical effects in crystalline solids. For instance, the phonon spectrum evaluates the thermal conductivity of materials, and phonon anomalies might indicate the Fermi surface nesting to the superconducting gap.
Phonon spectra can be obtained in numerous ways, and one among them is from DFT calculations, which are precise and advanced. However, when it comes to materials having strong electronic correlations and magnetoelastic coupling, it falls short.
At times, some analyses require the identification of reciprocal space points, in which phonon energies deviate from DFT predictions. Hence it is vital to extract linewidths, phonon energies, and eigenvectors directly from the data without depending on DFT.
X-ray scattering experiments or inelastic neutrons are powerful tools for evaluating phonon dispersions, and with the recent advancements in neutron scattering instrumentation, particularly the time-of-flight (TOF) instruments, researchers can effortlessly evaluate complete scattering spectra of single-crystal samples.
This approach also had numerous disadvantages, however, like neutron scattering intensity being dependent on the Brillouin zone (BZ), and the chance for missing interesting features found in the data when only a subset of BZs is analyzed. Also, there is the possibility of making errors in several overlapping resolution-limited peaks for a single broad peak. Also, this is a time-consuming process.
Research in the journal Quantum Beam Science presented a software tool—Phonon Explorer—that carries out a data analysis workflow that addresses the present problems. The workflow comprises steps like 1) Identifying relevant Brillouin zones, 2) Background determination and subtraction, 3) Optimization of binning, and 4) Employing multizone fit to extract phonon dispersions, linewidths, and eigenvectors.
This was applied to experiments involving the measurement of all phonons and specific phonons or phonon branches. The current study concentrates on phonons, as their scattering intensity is higher at large wavevectors. This article elaborates on each step of the workflow along with various examples.
Methodology
To enhance data usage, the analysis should cover each BZ. The scattering intensity of every phonon is evaluated by the phonon structure factors. The initial step includes the identification of zones where scattering from phonons of interest has substantial intensity.
The dataset covered 1500 Brillouin zones and 1454 cuts were obtained (see Figure 1). Spectra plotted in blue does not depict any identifiable one-phonon scattering, while the red spectra depict broad peaks originating from one or more overlapping phonon peaks.
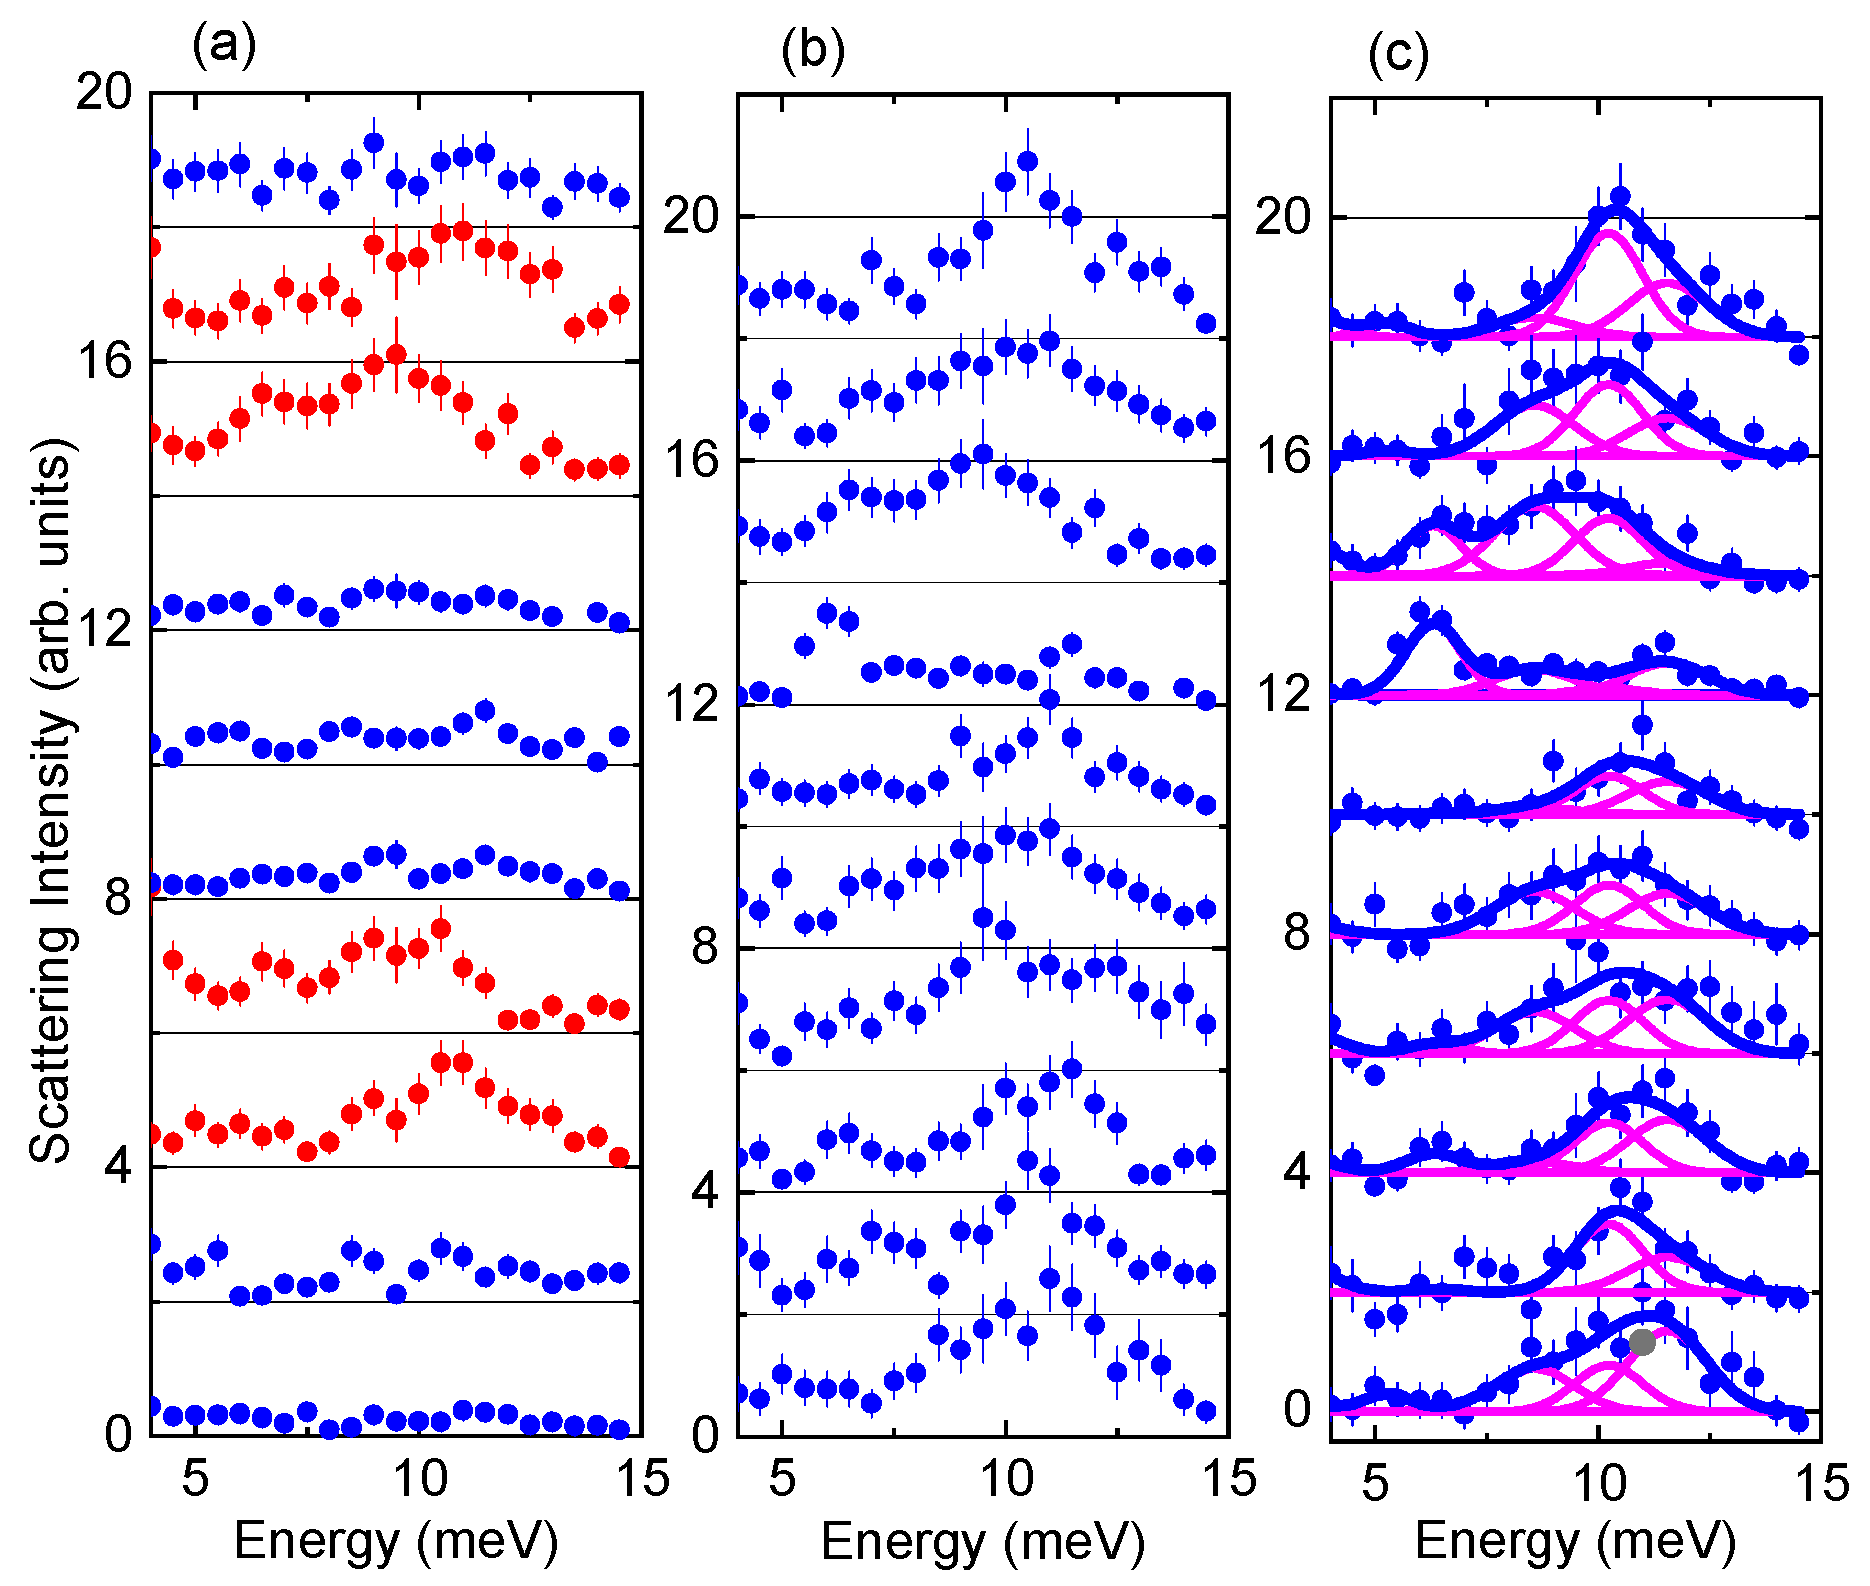
Figure 1. Zone center phonon data obtained from measured S (Q, ω) of Ba8Ga16Ge30. The binning was ΔH = ΔK = ΔL = ±0.1 reciprocal lattice units (r.l.u.). The wavevectors (H,K,L) in order from top to bottom are: (a) Q = (2,−1,−3), (−2,−1,−7), (−2,−1−9), (−4,0−11), (−4,0,−3), (−4,0,−4), (−4,0,−6), (−1,0,−10), (−10,−9,2), (−7,−9,3); For (b, c): Q = (−9,−10,−4), (−8,−7,−10), (−7,−8,−9), (−1,−4,−3), (−10,−9,2), (−3,−4,−9), (−5,−9,−8), (−6,−8,−9), (−7,−10,−2), (−1,0,−10). (a, b) data points represent raw data. (c) data points represent background-subtracted data. Magenta curves represent individual phonon peaks determined through the multizone fit. Blue curves are fit results. Peak positions based on the fit are: 5.3 ± 0.1, 6.3 ± 0.1 8.6 ± 0.15, 10.2 ± 0.1, and 11.6 ± 0.2 meV. Image Credit: Reznik, and Ahmadova, 2020
The cuts were visually examined and 35 BZs were identified. The Phonon Explorer software laid out the plots in around 30 minutes.
Background Determination and Subtraction
After identifying the useful Brillouin zones, the background should be subtracted from the data. This software supports many possible background determinations and along with automatic constant background subtraction, the software also includes an option to make manual adjustments by eliminating the user-defined linear background.
With the help of a standard smoothing procedure, the background is made equal to the point-by-point minimum of smoothed data.
Figure 2 depicts the background determination in an investigation of Cu-O bond stretching phonons. Here, a strong background emerges from the sample holder and incoherent scattering by the sample.
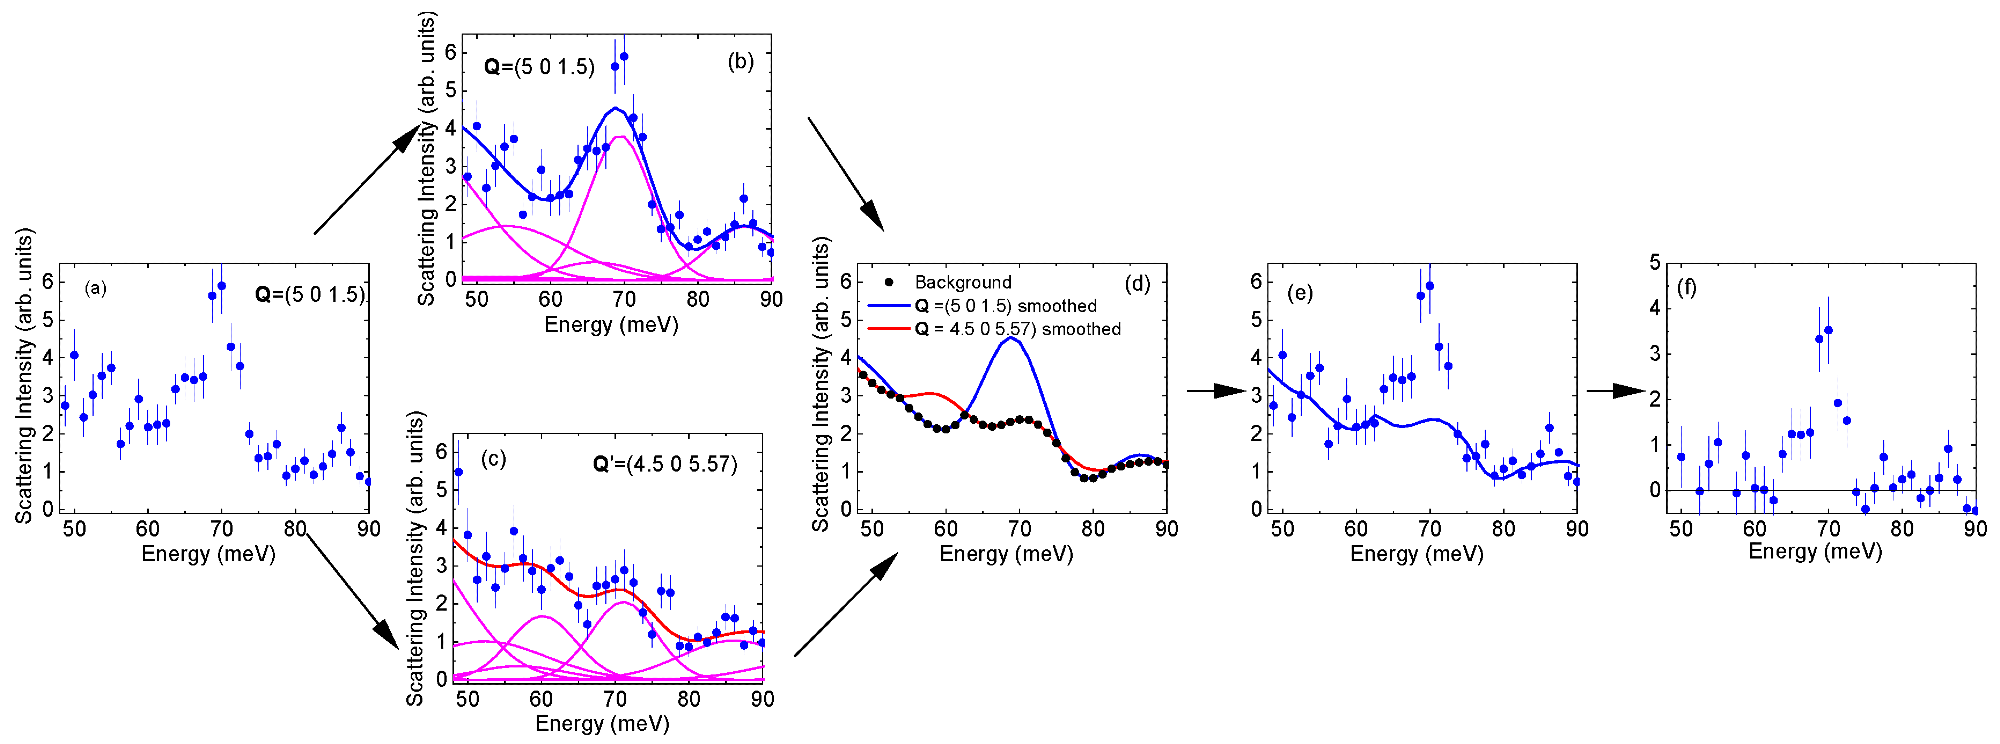
Figure 2. Background subtraction workflow described in the text. (a) Raw data; (b, c) Raw data with a smooth curve represented by the blue line. Blueline is obtained from fitting to a sum of Gaussian peaks represented by magenta lines; (d) Background is the point-by-point minimum of the two smooth curves; (e) Raw data with background; (f) Background-subtracted data. Image Credit: Reznik, and Ahmadova, 2020
The background indicated by the black dots in Figure 2c is the point-by-point minimum of the curves. The software assists in the extension of this procedure. It is possible to evaluate multiple scattering if the phonon spectrum and sample shape are known.
Results and Discussion
With the progress in data analysis progresses, there occurs a need to reassess if the originally selected binning in crystal momentum is optimal. It is better to repeat the earlier two steps for various binning values to find which works better. After identifying the optimal binning, the raw data should be histogrammed from the event mode data utilizing optimal binning.
Multizone fitting takes advantage of the fact that amplitude varies from zone to zone by fitting constant Q cuts in various Brillouin zones. Multizone fitting enhances the precision of the peak position and linewidth determination. Figure 3 shows the multizone fit for the bond-stretching phonon in Hg1201. Data from seven Brillouin zones was used.
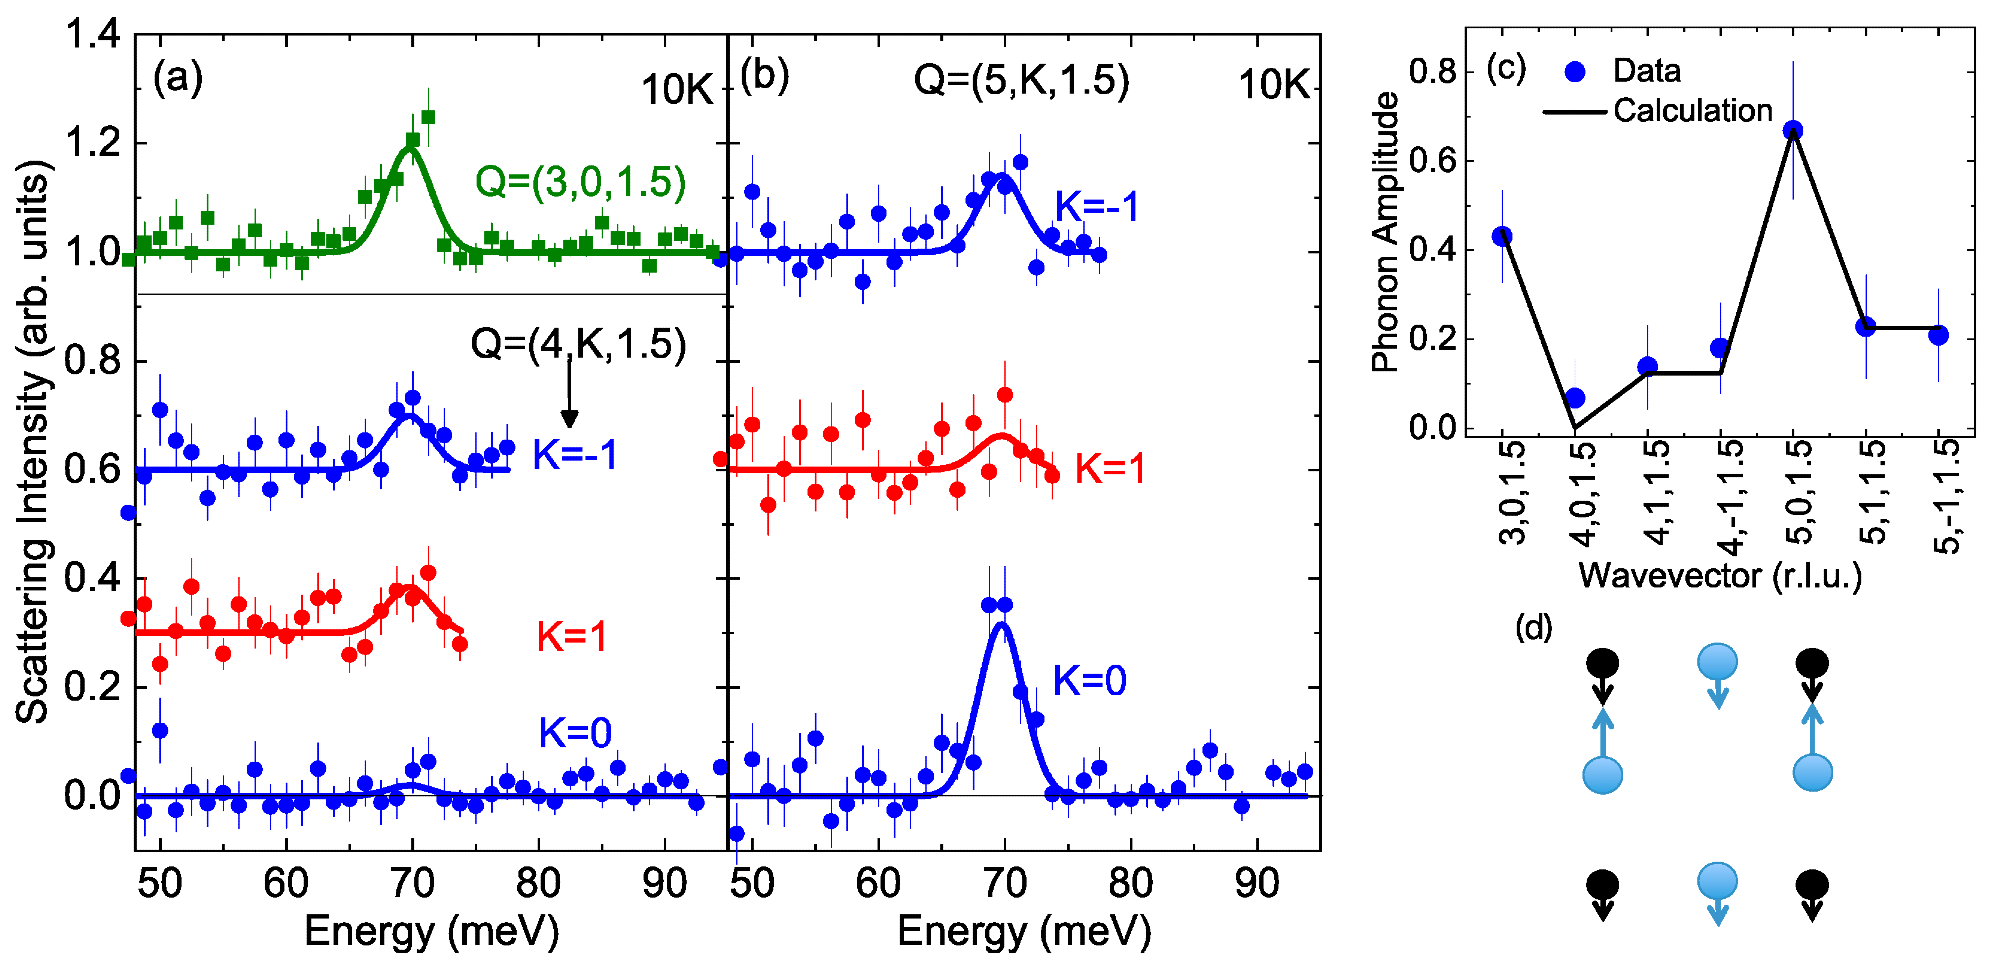
Figure 3. Zone-center bond-stretching phonon. (a, b) Solid line is the result of a multizone fit (see text) to the background-subtracted data (symbols). (c) Integrated intensity of the phonon at different wavevectors compared with the prediction based on the eigenvector shown in (d). (d) Eigenvector of the bond-stretching phonon. Small black circles represent Cu ions, large blue circles represent O. Arrows represent the phonon eigenvector drawn to scale. The eigenvector was extracted from phonon intensities in (a, b). Image Credit: Ahmadova, et al., 2020.
Multizone fit is utilized to analyze the dispersion of the bond-stretching phonons (see Figure 4).
![Cu-O bond-stretching and bond-bending longitudinal phonon dispersion along [100]. (a, b) Background-subtracted data at wavevectors with large bond-stretching phonon structure factor and small bond-bending structure factor. Binning: ?H = ±0.07, ?K = ±0.08, and ?L = ±3.5. (c) Dispersions of the bond-stretching (blue) and bond-bending phonon branches (red). For the bond-stretching phonon peaks, the multizone fit was made to the data at each q in the two zones shown in (a, b). The bond-bending (lower) branch peak positions were fixed to the values obtained based on wavevectors adjacent to (4, 0, 0), (4, 1, 0), and (4, -1, 0). (d) Raw-data peak widths (FWHM) extracted from the same fits as in (c). The effective resolution width increases when the dispersion is steeper.](https://www.azoquantum.com/images/Article_Images/ImageForArticle_259_16390503805889687.png)
Figure 4. Cu-O bond-stretching and bond-bending longitudinal phonon dispersion along [100]. (a, b) Background-subtracted data at wavevectors with large bond-stretching phonon structure factor and small bond-bending structure factor. Binning: ΔH = ±0.07, ΔK = ±0.08, and ΔL = ±3.5. (c) Dispersions of the bond-stretching (blue) and bond-bending phonon branches (red). For the bond-stretching phonon peaks, the multizone fit was made to the data at each q in the two zones shown in (a, b). The bond-bending (lower) branch peak positions were fixed to the values obtained based on wavevectors adjacent to (4, 0, 0), (4, 1, 0), and (4, −1, 0). (d) Raw-data peak widths (FWHM) extracted from the same fits as in (c). The effective resolution width increases when the dispersion is steeper. Image Credit: Ahmadova, et al., 2020.
Phonon Explorer software was used to implement the majority of the workflow elaborated above. This software is written in Python. The software facilitates the investigation of neutron scattering functions at a specifically reduced wavevector. It is also possible to enter a list of total wavevectors of interest. The software promotes a novel conceptual means of thinking.
Workflow automation boosts data processing, making comparative studies of phonon dispersions with DFT calculation results. Figure 5 illustrates phonon peak positions procured with the software compared with DFT results. It is to be noted that a complete cycle of extensive data analysis requires 2–3 weeks based on the level of familiarity with the software.
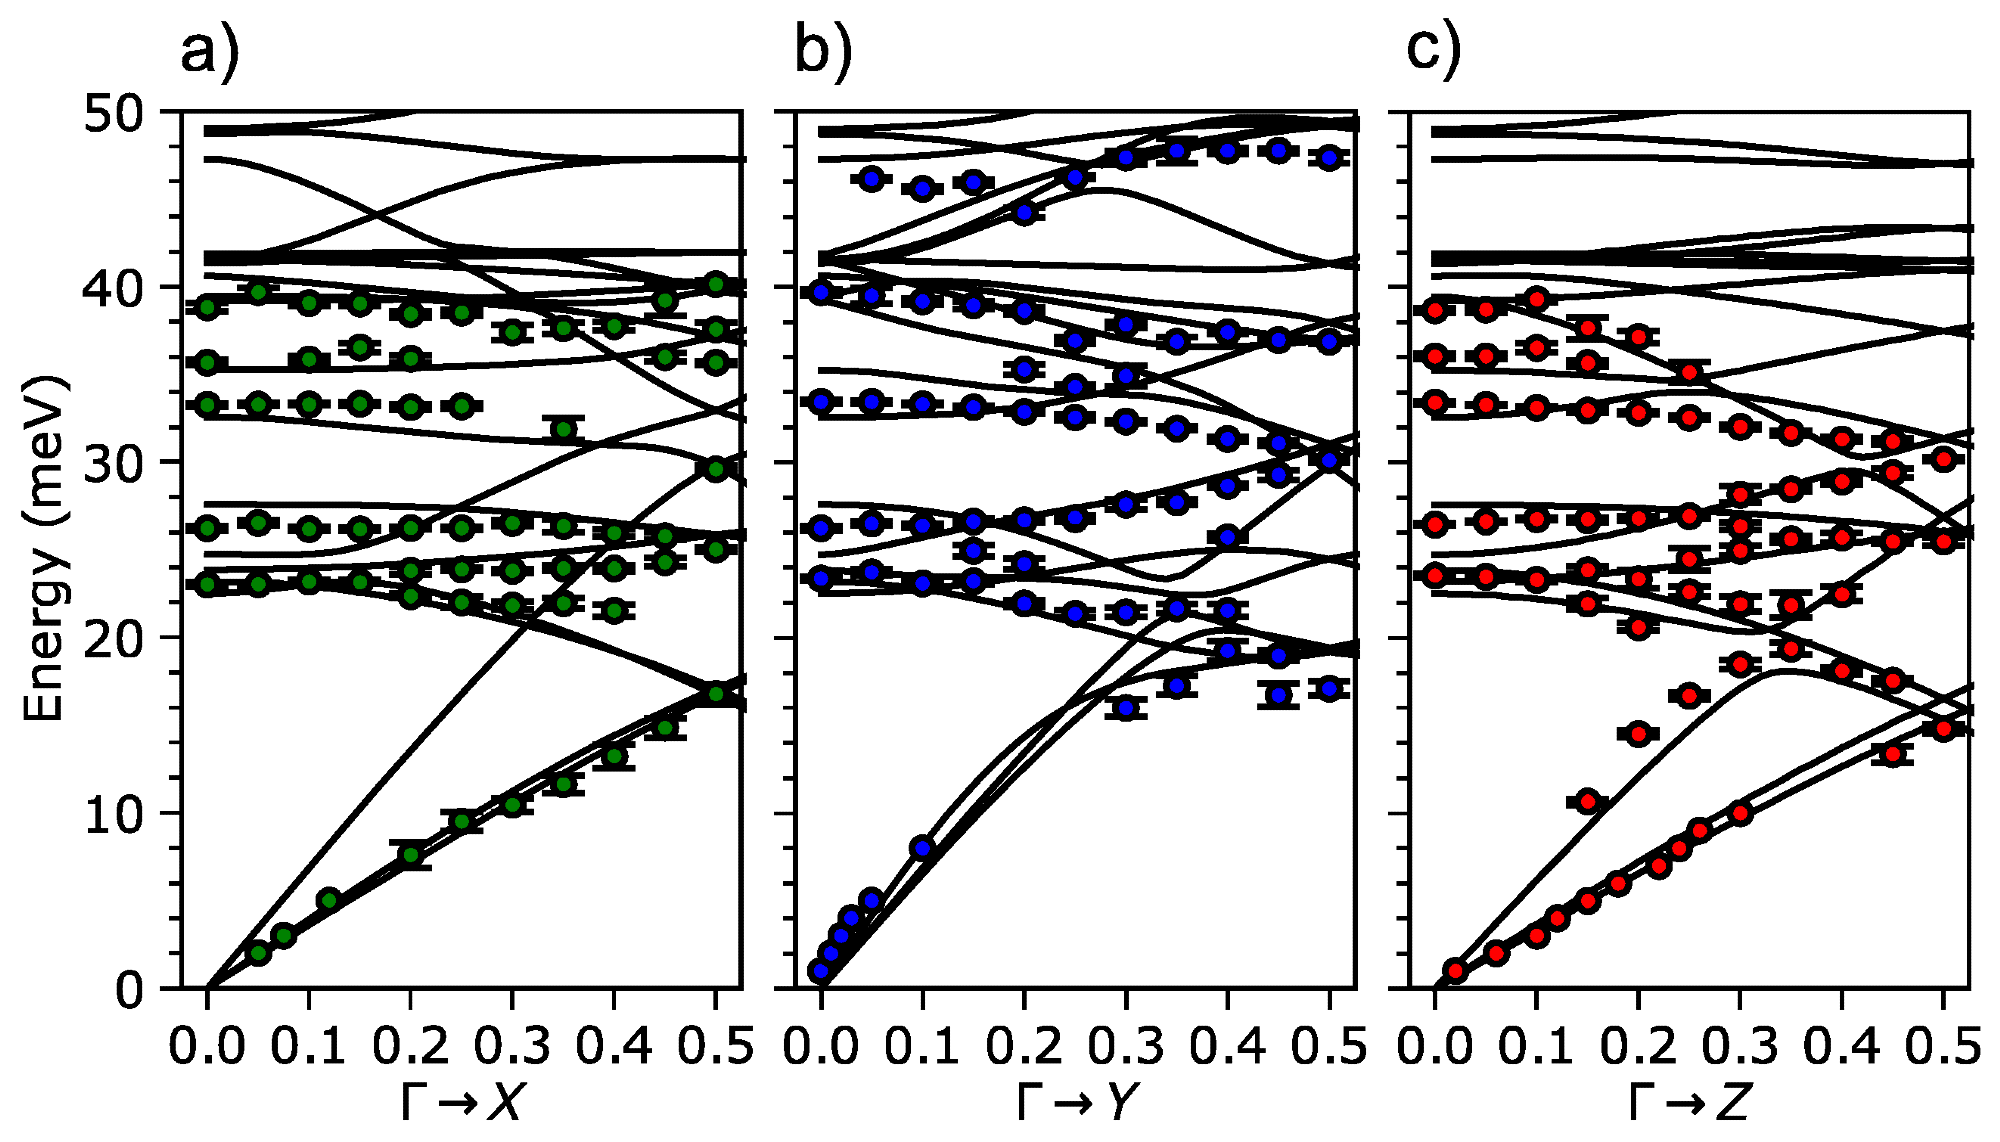
Figure 5. Phonon energies in FeP extracted from TOF data with the help of the Phonon Explorer software compared with DFT calculation results (a) Γ-X direction; (b) Γ-Y direction; (c) Γ-Z direction. Image Credit: Sukhanov, et al., 2020
Conclusion
The Phonon Explorer software was used triumphantly in three completed research projects spanning different experimental conditions.
This software aids in differentiating a broad peak and multiple closely-spaced peaks, distinguishing branch crossings and electron-phonon anomalies, enhancing the precision of fitting data. It also facilitates the effective search for new data mining and physics in TOF datasets, subtracts background from the data, and automates complete cycle data analysis.
The Phonon Explorer software when installed on chopper spectrometers provides the users the opportunity to carry out quick, robust, real-time data analysis.
Journal Reference:
Reznik, D & Ahmadova, I (2020) Automating Analysis of Neutron Scattering Time-of-Flight Single Crystal Phonon Data. Quantum Beam Science, 4(4), p. 41. Available online: https://www.mdpi.com/2412-382X/4/4/41/htm.
References and Further Reading
Toberer, E. S., et al. (2012) Advances in Thermal Conductivity. Annual Review of Materials Research, 42, p. 179. doi.org/10.1146/annurev-matsci-070511-155040.
Kohn, W (1959) Image of the Fermi Surface in the Vibration Spectrum of a Metal. Physical Review Letters, 2, p. 393. doi.org/10.1103/PhysRevLett.2.393.
Chan, S-K & Heine, V (1973) Spin density wave and soft phonon mode from nesting Fermi surfaces. Journal of Physics F: Metal Physics, 3, p. 795. doi.org/10.1088/0305-4608/3/4/022.
Reznik, D (2012) Phonon anomalies and dynamic stripes. Physica C: Superconductivity, 481, p. 75. doi.org/10.1016/j.physc.2012.01.024.
Allen, P. B., et al. (1997) Neutron-scattering profile of Q≠0 phonons in BCS superconductors. Physical Review B, 56, p. 5552. doi.org/10.1103/PhysRevB.56.5552.
Weber, F., et al. (2008) Direct observation of the superconducting gap in phonon spectra. Physical Review Letters, 101, p. 237002. doi.org/10.1103/PhysRevLett.101.237002.
Reznik, D., et al. (2008) Photoemission kinks and phonons in cuprates. Nature, 452, p. E6. doi.org/10.1038/nature07364.
Giustino, F (2017) Electron-phonon interactions from first principles. Reviews of Modern Physics, 89, p. 15003. doi.org/10.1103/RevModPhys.89.015003.
Ahmadova, I., et al. (2020) Phonon spectrum of underdoped HgBa2CuO4+δ investigated by neutron scattering. Physical Review B, 101, p. 184508. doi.org/10.1103/PhysRevB.101.184508.
Squires, G L (2012) Introduction to the Theory of Thermal Neutron Scattering; Dover Publications: Mineola, NY, USA.
Abernathy, D. L., et al. (2012) Design and operation of the wide angular-range chopper spectrometer ARCS at the Spallation Neutron Source. Review of Scientific Instruments, 83, p. 15114. doi.org/10.1063/1.3680104.
Ashcroft, N. W., et al. (1976) Solid State Physics. Holt Rinehart and Winston: New York, NT, USA.
Merritt, A. M., et al. (2020) Giant electron-phonon coupling of the breathing plane oxygen phonons in the dynamic stripe phase of La1.67 Sr 0.33 NiO4. Scientific Reports, 10, p. 11426. doi.org/10.1038/s41598-020-67963-x.
Sukhanov, A. S., et al. (2020) Lattice dynamics in the double-helix antiferromagnet FeP. arXiv 2020, arXiv:2009.07267.
Bewley, R. I., et al. (2006) MERLIN, a new high count rate spectrometer at ISIS. Physica B, 385–386, pp. 1029–1031. doi.org/10.1016/j.physb.2006.05.328.
Christensen, M., et al. (2008) Avoided crossing of rattler modes in thermoelectric materials. Nature Materials, 7, p. 811. doi.org/10.1038/nmat2273.
Parshall, D., et al. (2014) Phonon spectrum of SrFe2As2 determined using multizone phonon refinement. Physical Review B, 89, p. 064310. doi.org/10.1103/PhysRevB.89.064310.
Pintschovius, L., et al. (2014) Spurious peaks arising from multiple scattering events involving the sample environment in inelastic neutron scattering. Journal of Applied Crystallography, 47, p. 1472. doi.org/10.1107/S1600576714010140.
Reznik, D (2020) Available at: https://github.com/dmitryr1234/phonon-explorer.
Arnold, O., et al. (2014) Mantid—Data analysis and visualization package for neutron scattering and μSR experiments. Nuclear Instruments and Methods in Physics Research Section A: Accelerators, Spectrometers, Detectors and Associated Equipment, 764, p. 156. doi.org/10.1016/j.nima.2014.07.029.
Alvarez, R., et al. (2013) Mantid—Manipulation and Analysis Toolkit for Instrument Data. Mantid Project.
Ewings, R. A., et al. (2016) Software for the analysis of data from single crystal spectroscopy experiments at time-of-flight neutron instruments. Nuclear Instruments and Methods in Physics Research Section A: Accelerators, Spectrometers, Detectors and Associated Equipment, 834, pp. 132–142. doi.org/10.1016/j.nima.2016.07.036.