The IRTracer-100 FTIR Spectrophotometer from Shimadzu has an improved interferometer and detector design. It offers superior sensitivity with a 60,000:1 S/N ratio. When the LabSolutions IR Contaminant Analysis Macro is combined with this sensitivity; easier, faster, and more precise analysis of small samples can be conducted.
The IRTracer-100 system can be customized by users, with a number of accessories and user-friendly software options to match the requirements of a specific application.
Key Features
The main features of the IRTracer-100 FTIR Spectrophotometer are as follows:
- High resolution, speed and sensitivity - Maximum SN ratio in its class at 60,000:1, 0.25 cm-1 resolution, and high-speed scanning capable of 20 spectra/second
- Obtain high-resolution spectra with a 0.25 cm-1 resolution setting
- Reliable high performance
- Achieves high-speed analysis with a 20 Hz rapid scan feature
- Incorporated with advanced dynamic alignment; enables the removal of influence caused by environmental variations; allows the FTIR to be powered off when not in use; decreased warm-up times and improved stability; and maintenance-free system
- Integrated automatic dehumidifier allows for easy maintenance
- Advanced workstation with a rapid, user-friendly LabSolutions IR Series Software
- Windows applications or LabSolutions IR Programs can be operated easily with the Dedicated LabSolutions IR Launcher.
Applications
The IRTracer-100 FTIR Spectrophotometer is used in several areas such as:
- Construction
- Metals analysis
- Examining of additives in plastics
- Cosmetics - analysis of contaminants
- Automobile - Failure analysis
- Food products - packaging material identification
- Environmental - water analysis, gas analysis, soil analysis
- Chemicals and polymer analysis
- Electrical, electronics, and semiconductors
- Pharmaceuticals - raw material identification testing
- High-speed monitoring of curing reaction in UV-irradiated resin by a quick scan
FTIR-ATR Spectroscopy Analysis of Additives in Plastics
Polymers, such as polypropylene (PP) and polyethylene (PE), are the key components of commercially available plastic products, which also contain other additives in trace quantities to enhance performance and maintain quality. The analysis of additives used in plastic bags by exploiting the high S/N ratio of the Shimadzu FTIR IRTracer-100 spectrophotometer is described here.
Shimadzu IRTracer-100 FTIR Spectrophotometer and ATR Attachment MIRacle A
Single reflection ATR is an extensively used IR spectroscopy method for easy, non-destructive analysis of additives in plastic products. This technique enables measurements to be performed without any sample pretreatment, making it suitable for many applications, including contaminant determination.
As the depth of penetration of the infrared light into the sample’s surface is on the order of a few microns, the ATR technique is suitable for additives localized on the surface of the sample. The target component’s peak intensity in the measured infrared spectrum will decrease when its content ratio becomes smaller. An instrument with a high S/N ratio has to be used to accomplish better evaluation results.
The Shimadzu FTIR IRTracer-100 has a high S/N ratio of 60000:1, providing precise and stable peak data even for additives in trace quantities.
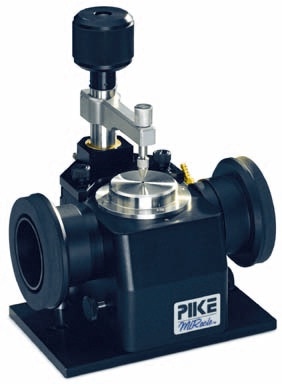
Figure 1. MIRacle A Single Reflection ATR Accessory
Measurement
The single reflection ATR technique was used to measure the surface of plastic bags that are commercially available. (Figure 2)
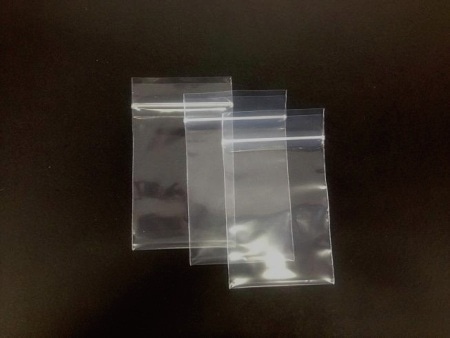
Figure 2. Plastic bags
Table 1 lists the measurement conditions and Figure 3 illustrates the spectrum search results and the measurement results.
Table 1. FTIR measurement conditions
| Instruments |
IRTracer-100, MIRacle A (Diamond prizm – ZnSe support element) |
| Resolution |
4 cm-1 |
| Accumulation |
20 |
| Apodization |
Happ-Genzel |
| Detector |
DLATGS |
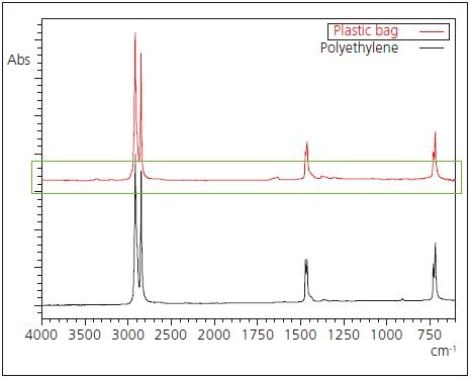
Figure 3. Infrared spectrum and search result for plastic bag
The analysis results match well with the library spectrum of polyethylene, indicating that the key component in the product is polyethylene. An expanded view in the vicinity of the baseline of Figure 3 is illustrated in Figure 4.
The arrow-indicated peaks seen Figure 4 are assumed to be acquired from additives used in the plastic bags. The results are in good conformity with the spectra of aliphatic amides such as oleamide. Aliphatic amides are added to resins to act as lubricants.
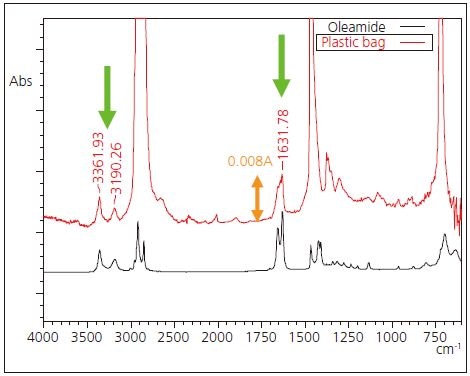
Figure 4. The expanded infrared spectrum of Figure 3 and the spectrum of oleamide
Once the measurement illustrated in Figure 3 was completed, the sample was removed from the ATR prism and another measurement was performed without washing the prism. The measurement results shown in Figure 5 are same as the spectrum of the aliphatic amide shown in Figure 4, indicating that the additive in the sample is transferred to the ATR prism.
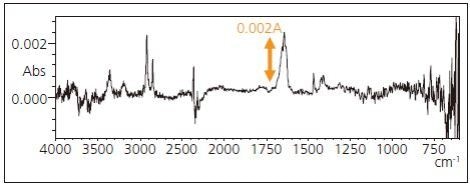
Figure 5. An infrared spectrum of substance transferred to ATR prism
The peaks linked to the aliphatic amide that became visible in the measurement results of Figures 4 and 5, respectively, display very weak intensity with absorbance values less than 0.010 A. A peak is also noticed at approximately 1631 cm-1, a region that plainly highlights the existence of water vapor in the air.
The hypothesis that the measurement system did not need nitrogen gas or dry air purging allowed these tiny peaks to be visibly detected.
Investigation of Repeatability of Small Peaks
The content level can be established using the area and height value of the peak acquired from the target component, but the measurement repeatability is important for tiny peaks gained from additives.
Ten repeat measurements were performed continuously with a plastic bag sample in close contact with the ATR prism. The peak area values of the peak at approximately 1631 cm-1 and the measured CV values are shown in Table 2.
Table 2. Peak area and CV values
| |
|
IRPrestige-21 |
|
IRTracer-100 |
| Area value |
|
No. of
Integrations
20 times |
|
No. of
Integrations
1 time |
|
No. of
Integrations
20 times |
|
No. of
Integrations
1 times |
| |
1.034 |
|
0.956 |
|
1.039 |
|
1.034 |
| |
1.049 |
|
1.006 |
|
1.025 |
|
1.021 |
| |
1.034 |
|
1.138 |
|
1.015 |
|
0.957 |
| |
1.008 |
|
1.052 |
|
1.006 |
|
0.952 |
| |
1.029 |
|
0.888 |
|
0.991 |
|
1.055 |
| |
0.967 |
|
0.974 |
|
0.996 |
|
1.055 |
| |
0.983 |
|
0.965 |
|
1.001 |
|
0.940 |
| |
0.967 |
|
0.970 |
|
0.972 |
|
0.995 |
| |
0.972 |
|
1.038 |
|
0.972 |
|
0.995 |
| |
0.957 |
|
1.011 |
|
0.982 |
|
0.995 |
| CV value % |
|
3.46 |
|
6.72 |
|
2.19 |
|
4.16 |
The integration was frequently conducted for twenty times and one time, and the resulting values were compared with the respective values obtained using the Shimadzu IRPrestige-21.
The improved stability of the measurement results offered by the IRTracer-100 is because of its higher S/N ratio.
Conclusion
Evaluation of additives present in trace quantities in the plastic resin has been discussed in this article. Due to the exceptional S/N ratio of the Shimadzu FTIR IRTracer-100, minute peaks derived from these additives were visibly and reliably obtained.